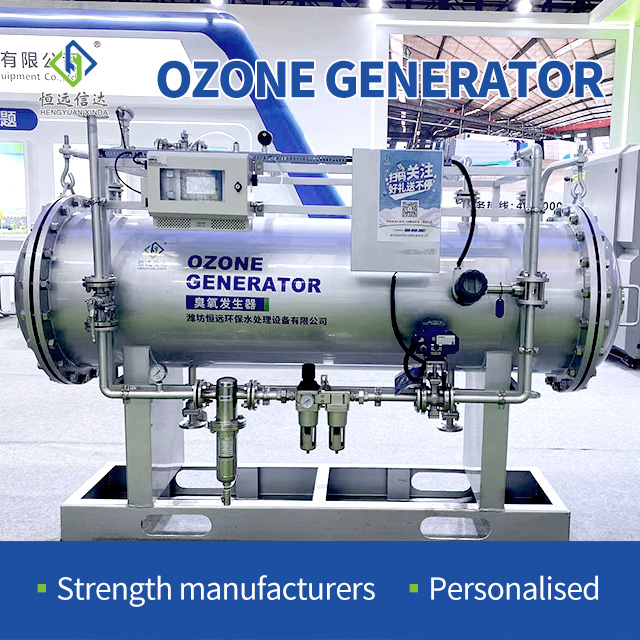
Facility operators face a constant battle when engineering disinfection systems for varying flow rates and shifting contamination levels. Guessing the required gas concentration leads to severe dual risks that jeopardize the entire operation. Under-dosing results in failed compliance, allowing dangerous pathogen breakthrough that compromises public health or product integrity. Conversely, over-dosing accelerates equipment degradation, wastes capital on unnecessary power consumption, and introduces the severe risk of regulatory fines due to bromate formation in bromide-rich waters.
To ensure reliable, compliant disinfection, engineers must move away from static estimates and rely on a strict technical framework for calculating the exact ozone dosage for water treatment. This methodology requires a deep understanding of fluid dynamics and oxidation chemistry. It factors in baseline water quality variables, precise contact time within the reaction vessels, and accurate equipment sizing. By applying these engineering principles, facilities can design a robust system that delivers precise microbial inactivation while optimizing operational efficiency.
The CT Value is the Ultimate Metric: Disinfection success is not just about concentration (ppm); it requires calculating Concentration multiplied by Contact Time (CT) for specific target pathogens.
Baseline Dosage Varies by Application: General water disinfection typically targets a residual of 0.2 to 0.4 ppm, whereas stringent applications like bottled water (IBWA standards) require applied doses of 1.0 to 2.0 mg/L.
Generator Sizing Requires System-Level Math: Sizing an ozone generator requires calculating total water flow rate, desired applied dose, and the specific mass transfer efficiency of the injection system.
Water Quality Dictates Demand: Pre-existing organic loads, turbidity, iron, manganese, and water temperature will consume ozone before disinfection begins, necessitating a thorough water quality analysis prior to equipment specification.
The Science of Ozone Dosage for Water Treatment: The CT Value Framework
Static dosing fails entirely in dynamic water systems because flow rates, fluid temperatures, and organic loads constantly shift throughout the operational day. Relying on a fixed injection rate without measuring the actual microbial inactivation guarantees inconsistent results and frequent compliance failures. Operators need a measurable, verifiable standard to confirm that pathogens are neutralized before the fluid reaches the next process stage. This requires shifting from a mindset of simple chemical addition to a framework of verified contact and exposure.
Defining the CT Value (Concentration x Time)
The CT value serves as the foundational metric for all modern disinfection protocols. Operators calculate it by multiplying the dissolved oxidant concentration, measured in milligrams per liter (mg/L) or parts per million (ppm), by the contact time, measured in minutes. This calculation determines the total oxidative exposure a microorganism endures. The gas acts as an exceptionally aggressive oxidant that destroys pathogens through direct cell wall lysis, physically tearing the cell apart rather than merely poisoning its internal enzymes.
Because of this aggressive mechanism, the required CT value is typically less than 1 for most standard bacteria. Applying 1 ppm of dissolved gas for just 1 minute achieves faster disinfection and oxidation than significantly higher equivalent doses of chlorine or hydrogen peroxide. This rapid reaction kinetic allows facilities to utilize much smaller contact tanks compared to traditional chlorination systems, saving valuable floor space while achieving superior microbial kill rates.
Pathogen-Specific Destruction Thresholds
Different microorganisms exhibit vastly different levels of resistance to chemical oxidation. System engineers must design the contact chambers and set the applied dose based on the most resistant pathogen likely present in the source fluid. Standard vegetative bacteria and fragile viruses succumb rapidly to oxidative stress. Achieving a 99.99% (4-log) destruction rate for common contaminants like E. coli or Legionella often requires just 0.5 ppm with a mere 6 seconds of exposure.
However, highly resilient protozoa dictate the upper limits of your dosage requirements. Pathogens such as Cryptosporidium and Giardia possess tough, protective outer cysts that demand significantly higher CT values to achieve inactivation. Overcoming these cyst walls requires sustained exposure to higher residuals. Regulatory frameworks often require CT values exceeding 2.0 to guarantee the destruction of these resilient protozoa, forcing engineers to design larger contact vessels or increase the output capacity of the gas production system.
Mapping the required dosages to specific industrial and municipal use cases guides decision-makers toward their relevant regulatory baseline. There is no universal dosage rate; the application dictates the chemistry. Understanding the specific goals of your sector ensures that you engineer a system capable of meeting jurisdictional requirements without over-capitalizing on unnecessary hardware.
Municipal and Large-Scale Water Disinfection
Municipal facilities operate under strict government and jurisdictional requirements designed to protect massive populations. These plants typically target a residual concentration between 0.2 and 0.4 ppm at the end of the primary contact chamber. In these large-scale distribution grids, advanced oxidation acts as the primary, rapid disinfectant to neutralize immediate biological threats and break down complex organic compounds that cause taste and odor issues.
Because the dissolved gas decays quickly back into oxygen, it cannot provide long-term protection throughout miles of municipal piping. Therefore, plants follow up the primary oxidation stage with a secondary residual chemical, such as chloramine or free chlorine. The initial oxidation stage significantly reduces the organic load, which in turn drastically lowers the formation of harmful disinfection byproducts when the secondary chlorine enters the grid.
Bottled Water and Beverage Production
Beverage production demands absolute sterility without altering the final taste or introducing chemical odors. The International Bottled Water Association (IBWA) provides strict guidelines for this sector, recommending that facilities apply an initial dose in the 1.0 to 2.0 mg/L range during the final treatment stage. This high initial dose ensures that any remaining organics are completely oxidized before the fluid reaches the filler block.
The primary goal in bottling applications is maintaining a precise 0.1 to 0.4 ppm residual at the exact time the fluid enters the bottle. This active residual sanitizes the inner walls of the container and the cap immediately after sealing, providing a final layer of quality assurance. Within hours of capping, the active oxidant naturally dissipates back into dissolved oxygen, leaving absolutely no chemical aftertaste and ensuring product purity.
Industrial, Agricultural, and Well Water Treatment
Raw well water utilized in industrial and agricultural settings often contains high levels of dissolved iron, manganese, and hydrogen sulfide. Advanced oxidation excels at precipitating these heavy metals and destroying the volatile compounds responsible for foul odors. The gas oxidizes soluble Iron (Fe2+) into insoluble Ferric Hydroxide (Fe3+), which operators then easily remove using downstream mechanical filtration.
High organic loads and heavy metal concentrations drastically increase the initial chemical demand. The system must satisfy this chemical oxygen demand (COD) before a disinfection residual can even be established. If operators fail to account for this baseline consumption, the injected gas will be entirely depleted by the metals and organics, leaving no active residual to destroy the bacteria. Field engineers typically follow a strict sequence for well water treatment:
Inject the oxidant to break the molecular bonds of dissolved metals and volatile organics.
Allow sufficient retention time in a contact vessel for complete flocculation and precipitation.
Pass the treated fluid through mechanical media filters (like greensand or multimedia) to capture the precipitated solids.
Measure the final effluent to ensure a stable, clean residual remains for downstream disinfection.
How to Size an Ozone Generator for Your Facility
Translating required fluid dosage into precise hardware specifications requires rigorous technical methodology. You cannot simply guess the required output capacity or rely on generic equipment ratings. Proper sizing ensures that the facility can handle peak flow rates and worst-case contamination scenarios without experiencing pathogen breakthrough.
Calculating Total Ozone Demand
The baseline calculation for equipment sizing relies on a standard fluid dynamics formula: Ozone Demand (g/hr) = Water Flow Rate (m³/hr) × Applied Dose (g/m³ or ppm). This calculation provides the absolute minimum gas production required to hit your target concentration. For example, treating 100 m³/hr of fluid with a target applied dose of 2.5 ppm requires a minimum production capacity of 250 grams per hour.
You must distinguish between the applied dose and the residual dose during this calculation phase. The applied dose represents the total amount of gas injected into the pipeline. The residual dose is what remains active after the initial oxidation of metals, organics, and nitrites. Your sizing calculations must account for the applied dose necessary to overcome the baseline fluid demand while still leaving enough active gas to achieve the required residual for disinfection.
Factoring in Mass Transfer Efficiency
No injection system dissolves 100% of the produced gas into the fluid stream. The physical injection method dictates the mass transfer efficiency, and failing to account for this loss will result in an undersized system. Venturi injectors combined with downstream static mixers create high-velocity pressure differentials, typically achieving 85% to 95% dissolution efficiency under optimal conditions.
Conversely, fine bubble diffusers installed at the bottom of contact basins rely on hydrostatic pressure and bubble rise time, generally achieving lower transfer efficiencies ranging from 70% to 85% depending on the depth of the basin. Engineers must inflate their initial generator sizing calculation to account for these inevitable physical transfer losses. If your mathematical demand is 250 g/hr and your injector is 85% efficient, you must specify a machine capable of producing at least 294 g/hr.
Injection Method
Typical Transfer Efficiency
Ideal Application
Venturi Injector with Static Mixer
85% - 95%
High-pressure inline piping systems
Fine Bubble Diffuser
70% - 85%
Deep municipal contact basins
Side-Stream Injection Loop
80% - 90%
Variable flow rate industrial facilities
Evaluating Generator Output and Scalability
Selecting an ozone generator with variable output controls is essential for long-term operational stability. Fluid dynamics and contamination levels are rarely static. A high turndown ratio allows operators to adjust the gas production linearly in response to seasonal fluid quality changes or fluctuating daily flow rates.
Fixed-output machines force operators to run at maximum capacity regardless of actual demand. This inflexibility forces the facility to over-dose during periods of low flow, wasting electrical power, depleting oxygen feed gas unnecessarily, and accelerating the degradation of downstream seals and gaskets. Variable frequency drives and precise dielectric power controls ensure the machine only produces the exact amount of gas required at any given moment.
Inline Measurement and Dosage Control
Verifying the applied dosage in real-time requires robust, industrial-grade instrumentation. Facilities utilize Oxidation-Reduction Potential (ORP) meters and amperometric dissolved sensors mounted directly in the pipeline or contact tank. ORP meters provide a relative measurement of total oxidative capacity, while amperometric sensors provide an absolute measurement of the dissolved gas concentration in parts per million.
These sensors must feed continuous data to automated Proportional-Integral-Derivative (PID) controllers. The PID controllers instantly adjust the generator's power output based on live residual readings. This closed-loop automation prevents dangerous under-dosing when flow rates spike and eliminates wasteful over-dosing when fluid demand drops, ensuring consistent compliance without requiring constant manual intervention from plant operators.
Pros, Cons, and Alternative Trade-Offs in Water Treatment
Adopting advanced oxidation involves analyzing complex financial and operational implications against traditional chemical methods. Facility managers must look beyond the initial purchase price and evaluate the long-term impact on plant safety, consumable costs, and regulatory compliance.
Capital Expenditure (CapEx) vs. Operational Efficiency (OpEx)
Installing an advanced oxidation system requires a significantly higher initial Capital Expenditure (CapEx) compared to standard chemical feed pumps. Facilities must purchase oxygen concentrators, high-voltage generators, stainless steel injection manifolds, and thermal destruct units. This upfront investment can be a barrier for smaller operations accustomed to cheap chlorine dosing equipment.
However, the long-term Operational Expenditure (OpEx) savings rapidly offset the initial hardware costs. Facilities completely eliminate bulk chemical storage, reducing hazardous material handling liabilities and lowering insurance premiums. Because the primary raw material is ambient air (concentrated into oxygen), ongoing consumable costs plummet. The facility gains supply chain independence, no longer relying on weekly chemical deliveries that are subject to price volatility and logistical disruptions.
Ozone vs. Chlorine and UV Systems
When comparing chemical options, advanced oxidation provides rapid reactions and leaves no residual taste or odor, making it superior for beverage and food processing. Chlorine offers a long-lasting residual ideal for municipal piping, but it generates highly regulated and harmful disinfection byproducts (DBPs), such as trihalomethanes (THMs) and haloacetic acids (HAAs), when it reacts with natural organic matter.
When comparing against ultraviolet (UV) light, advanced oxidation delivers both chemical precipitation (for metals and complex organics) and biological disinfection. UV systems only provide disinfection. Furthermore, UV requires highly clear fluid with high UV Transmittance (UVT) to function effectively. If the fluid contains iron, manganese, or high turbidity, the UV quartz sleeves will foul rapidly, blocking the light and rendering the system useless. Advanced oxidation actively destroys the compounds that cause fouling.
Treatment Method
Primary Function
Residual Capability
Byproduct Risk Profile
Advanced Oxidation (O3)
Oxidation & Disinfection
Short-lived (minutes to hours)
Bromate (only if bromide is present)
Chlorination
Disinfection
Long-lasting (days to weeks)
High (THMs, HAAs, Chloramines)
Ultraviolet (UV) Light
Disinfection Only
None (Zero residual)
None
Hydrogen Peroxide
Oxidation
Moderate
Low
Implementation Risks and Mitigation Strategies
Physical and chemical realities can easily derail a fluid treatment project if the system is not properly engineered. Understanding the limitations of the technology and implementing robust mitigation strategies during the design phase is critical to preventing operational failures and ensuring consistent regulatory compliance.
Managing Turbidity and Suspended Solids (The Shielding Effect)
While the dissolved gas is highly effective at destroying exposed pathogens, high turbidity in dirty fluid can physically shield bacteria and viruses from oxidation. Suspended solids act as physical barriers, absorbing the oxidative energy before it can reach the target microorganisms. If the fluid exceeds specific Nephelometric Turbidity Unit (NTU) limits, the disinfection process will fail regardless of the applied dose.
To mitigate this shielding effect, engineers must install proper pre-filtration strategies upstream of the injection point. Utilizing sand filters, multimedia vessels, or ultrafiltration membranes removes the suspended solids, lowering the turbidity and ensuring maximum direct contact between the dissolved oxidant and the target pathogens. Pre-filtration also reduces the baseline chemical demand, allowing you to achieve the target residual with a smaller, more efficient generator.
Managing Ozone Half-Life and Water Temperature
Fluid temperature dictates gas solubility and shares an inverse relationship with the oxidant's half-life. According to Henry's Law, colder fluids hold dissolved gases much longer and more efficiently. In cold applications, the oxidant maintains its structural integrity, extending the contact time naturally and requiring less overall gas production to achieve the target CT value.
Conversely, warmer fluids cause the dissolved gas to degrade rapidly back into standard oxygen. In high-temperature applications, the half-life shrinks from hours down to mere minutes. Operators must apply a significantly higher initial dose in warm fluids to ensure that a measurable residual survives until the end of the contact chamber. System sizing must always be calculated based on the maximum expected fluid temperature during peak summer months.
Water Temperature (°C)
Approximate Half-Life (pH 7.0)
15°C
30 minutes
20°C
20 minutes
25°C
15 minutes
30°C
12 minutes
Preventing Bromate Formation
Source fluids containing naturally occurring bromide present a severe and specific chemical risk. Aggressive oxidation converts harmless bromide ions into bromate, a heavily regulated carcinogen. Municipalities and beverage producers face strict legal limits on allowable bromate concentrations in finished products. Ignoring this chemical pathway can result in immediate facility shutdowns and massive regulatory fines.
Engineers employ several mitigation strategies to prevent bromate formation while still achieving microbial destruction. Depressing the fluid pH prior to injection shifts the chemical equilibrium away from bromate formation. Alternatively, adding trace amounts of ammonia can bind the intermediates. The most common strategy involves utilizing highly precise PID dosage control to stay strictly below the bromate formation threshold, applying only the exact amount of gas necessary for disinfection and nothing more.
Off-Gassing and Ambient Safety Compliance
Because no injection system is 100% efficient, undissolved gas will inevitably accumulate at the top of the contact tanks. This off-gas must be safely vented and neutralized. Releasing raw oxidant gas into the facility atmosphere poses a severe respiratory hazard to plant personnel and rapidly degrades nearby electronic equipment and rubber components.
Contact tanks require specialized destruct units—either thermal or catalytic—to convert the off-gas back into breathable oxygen before venting it to the atmosphere. Furthermore, facilities must adhere strictly to OSHA and NIOSH ambient air safety requirements, which limit worker exposure to 0.1 ppm over an 8-hour shift. Installing ambient monitors throughout the treatment facility ensures immediate generator shutdown and triggers evacuation alarms if dangerous gas levels escape into the workspace.
Conclusion
Implementing an advanced oxidation system requires moving beyond guesswork and embracing precise fluid dynamics and chemical engineering. To ensure a successful deployment, follow these next steps:
Conduct a comprehensive fluid quality analysis to determine baseline organic loads, heavy metal concentrations, and the presence of naturally occurring bromide.
Calculate your specific CT value requirements based on the most resilient pathogen likely to be present in your source fluid.
Size your injection system accurately by factoring in a minimum 15% margin to account for inevitable mass transfer efficiency losses.
Install inline amperometric sensors integrated with automated PID controllers to enable real-time dosage adjustments and prevent dangerous under-dosing.
FAQ
Q: How do I calculate the CT value for my water system?
A: You calculate the CT value by multiplying the dissolved oxidant concentration (measured in mg/L or ppm) by the total contact time (measured in minutes). You must then compare this numerical result against established pathogen destruction charts to ensure your system provides adequate exposure for complete disinfection.
Q: What is the standard residual target for municipal facilities?
A: Municipal treatment plants typically maintain a residual concentration between 0.2 and 0.4 ppm at the end of the primary contact chamber. This ensures immediate microbial destruction before secondary disinfectants, like chloramine, are added to protect the wider distribution grid.
Q: Does fluid temperature affect the required dosage?
A: Yes. Warmer fluids decrease gas solubility and drastically shorten the oxidant's half-life. Consequently, you must apply a significantly higher initial dose in warm fluids to achieve and maintain the same active residual compared to colder fluid applications.
Q: How do I prevent bromate formation during treatment?
A: You can prevent bromate formation by lowering the fluid pH, introducing trace amounts of ammonia, or strictly controlling the applied dose using PID automation. This ensures you do not over-oxidize naturally occurring bromide ions into regulated bromate.
Q: Why is pre-filtration necessary before gas injection?
A: High turbidity and suspended solids act as physical barriers, shielding bacteria and viruses from the dissolved gas. Pre-filtration removes these solids, lowering the chemical demand and ensuring direct, lethal contact between the oxidant and the target microorganisms.
Q: What is mass transfer efficiency in these systems?
A: Mass transfer efficiency refers to the exact percentage of produced gas that successfully dissolves into the fluid stream. Venturi injectors typically achieve 85% to 95% efficiency, meaning you must slightly oversize your generator to account for the undissolved gas that escapes.
It is a production-oriented high-tech enterprise integrating R&D, production and sales of water treatment equipment, disinfection equipment and ecological toilets. It has won the honorary titles of National.
 English
 العربية
 Français
 Русский
 Español
 Português
 Deutsch
 italiano
 日本語
日本語 한국어
한국어 Nederlands
 Tiếng Việt
 ไทย
ไทย Türkçe
 አማርኛ
አማርኛ ພາສາລາວ
 Bahasa Melayu
 Filipino
 Bahasa Indonesia
 magyar
 Română
 Монгол
 қазақ
қазақ Српски
 हिन्दी
 فارسی
فارسی Kiswahili
 Slovenščina
 Svenska
 Ελληνικά
 Suomi
Suomi Dansk
Dansk Shqip
Shqip বাংলা
বাংলা Oʻzbekcha
 Azərbaycan dili
 íslenska